Picture a Monday morning. Your team has just finished a campaign that should have been perfectly timed. The brief was sharp. The creative was strong. The audience definition was right. The offer was exactly what your customers needed to hear.
And the campaign went live twelve days after the reason you built it had passed.
A competitor's flash sale ended last week. Your product launch window closed Thursday. Your best customers had already decided — bought elsewhere, renewed at the old rate, moved on. Your perfectly built email landed in inboxes during the wrong week of the wrong quarter, for a moment that had already resolved itself without you.
Your data team did nothing wrong. They pulled the segment accurately, validated it carefully, and delivered it clean. Your campaign team executed fast from the moment the file arrived. The brief was clear.
Nobody made a mistake. The queue did what queues do.
I've watched this exact scenario play out across financial services, D2C brands, and B2B2C businesses with audiences in the tens of millions. It happens at companies with large analytics teams and companies with small ones. Budget doesn't fix it. Headcount doesn't fix it.
Most revenue leaders have no name for it. I gave it a name: The Jira Queue Tax.
What the Queue Tax Is
The Jira Queue Tax is the hidden revenue cost embedded in the data handoff chain your campaign team waits on — every single cycle, every single campaign.
It is not a technology problem. Not an ops problem. Not a data team problem. Not a talent problem.
It is a structural tax that accumulates in silence, compounding each quarter because nobody has ever measured it as a revenue line. Your CFO doesn't see it. Your board doesn't see it. Your agency doesn't flag it. It doesn't appear on any dashboard.
It appears in your CAC payback period slowly trending in the wrong direction. In your conversion rate hovering just below where your model says it should be. In the feeling — and it is a feeling most CMOs recognise immediately when named — that your team is always running one step behind the market.
That feeling has a mechanism. Here it is.
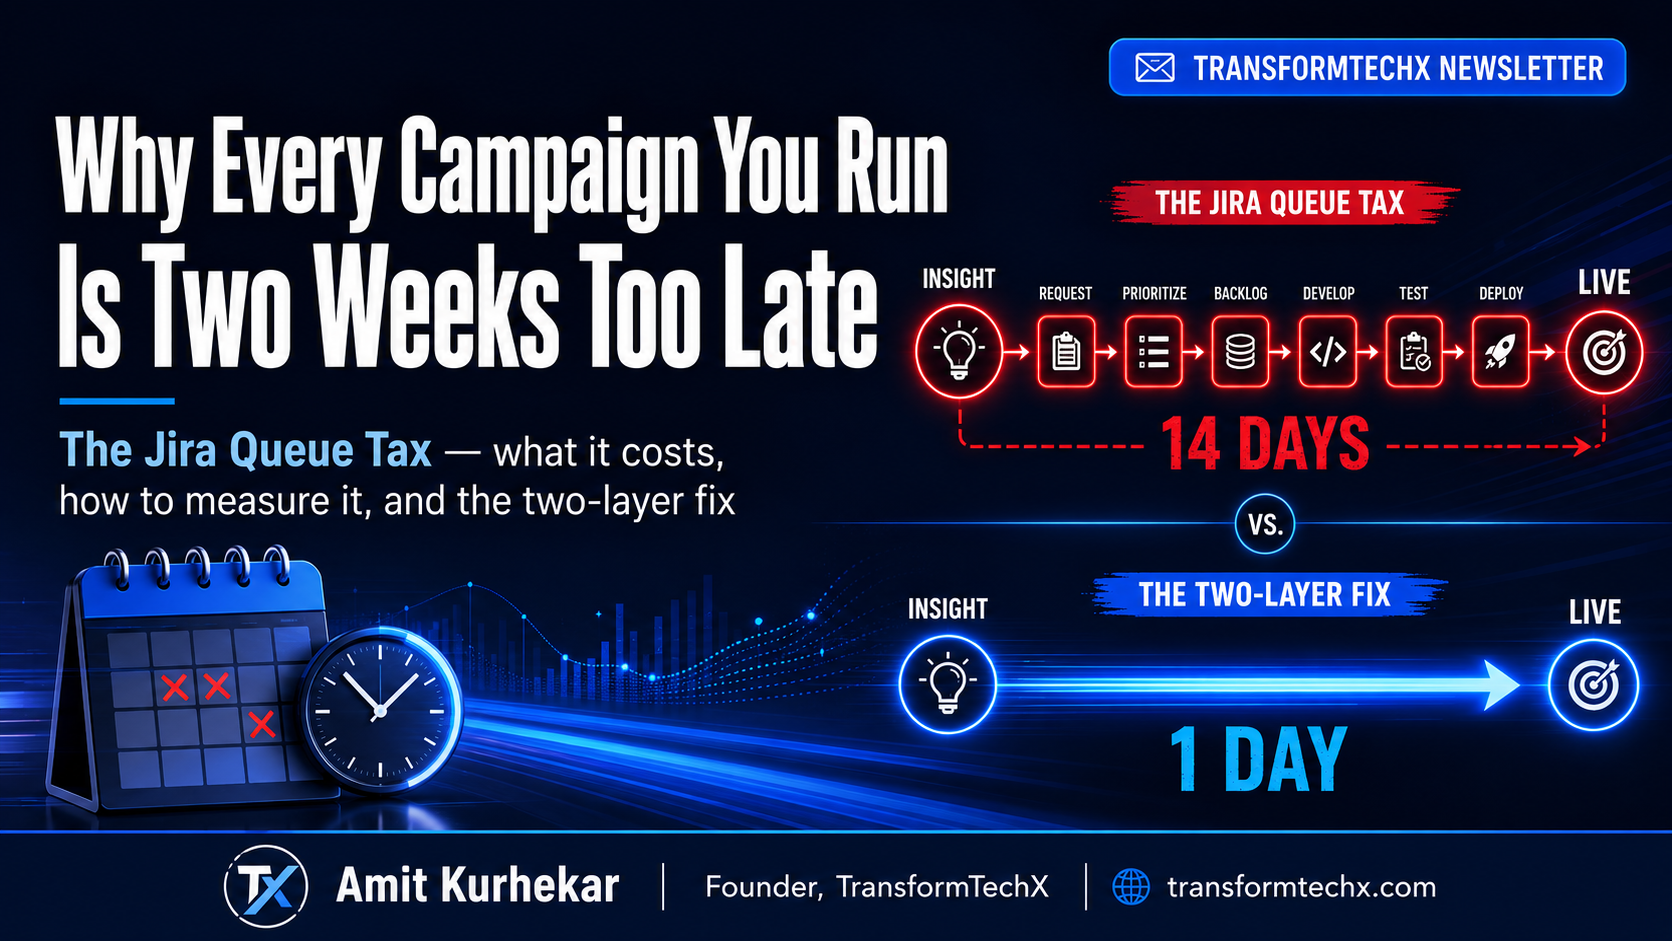
The Seven Steps Between Insight and Live
Map out what actually happens between the moment someone in your organisation identifies an opportunity and the moment a campaign reaches a customer.
A marketer sees a signal — a customer behaviour shift, a competitive event, a product trigger, a segment that's ready to convert. They need a campaign live. Before a single customer sees it, here is what happens:
- The request enters a queue — a ticket, a Slack message, an email thread, a form submission
- The data team picks it up in their next available sprint slot
- A data pull runs against the underlying system
- The output gets validated — a necessary step, not a wasteful one
- An audience segment gets built and tested
- The campaign team integrates the segment into the campaign workflow
- QA, compliance check (regulated industries), approval — then campaign goes live
Seven steps, with handoffs at most of them. In a well-run team — competent people, reasonable process — that chain takes ten to fourteen business days.
where campaigns launch after the revenue moment that prompted them — 2 weeks × 4 major campaigns per quarter. You are paying full acquisition cost for diminished return every single cycle.
And the compounding factor most revenue leaders do not see: you are paying full acquisition cost to reach an audience that has already partially decided. You are not missing the campaign. You are paying full price for a diminished return. Because the conversion window your campaign was built for has either narrowed or closed by the time your segment arrives.
That is the Jira Queue Tax. It is silent, structural, and accumulating every quarter on your P&L — just not in a line item anyone can point to.
Why This Is a Revenue Leader's Problem, Not a Data Problem
The first response I see from most CMOs and CROs when they map this out is to look toward the data team. Wrong direction.
Your data team is running exactly the system they were asked to build. The problem is that it was built for a different job.
The data infrastructure in most organisations was designed for reporting — to help leadership understand what happened last quarter. It was optimised for accuracy, governance, and consistency across a reporting cycle. It was never redesigned for activation — to move a campaign-ready audience to a live channel in the same hour a marketer identifies the need for it.
The three teams that exist between your marketer and your live audience were put there because the reporting chain required them. That org chart was drawn four or five years ago, before your campaigns needed to move at the speed of a market signal.
The requirements changed. The structure did not.
This pattern holds regardless of company size. I have seen the same queue tax at a ₹50 crore D2C brand and a ₹2,000 crore financial services firm. The names are different. The handoff chain is identical. More budget does not remove the tax. The constraint is not capacity — it is where the decision to activate sits, and how many people have to touch it before it moves.
What Removing It Actually Looks Like
The fix is not what most revenue leaders reach for first.
It is not hiring more analysts. It is not a new analytics platform or a better data pipeline. It is not improving the sprint velocity of your data team. I have watched companies do all of those things and take their queue from fourteen days to eleven days. Smaller tax. Still paying it.
The organisations that genuinely remove the queue tax do something structurally different. They collapse the handoff chain — not by making the steps faster, but by eliminating the handoffs entirely. They redesign who owns the path from insight to activation, so that path no longer requires three team boundaries and two sprint cycles to cross.
Here is what that looked like in practice at a financial services brand operating at scale — B2B2C, regulated, tens of millions of customers in the system.
Campaign activation was running at fourteen days average. The data team was not underperforming — they were running a clean, well-governed operation. But they were operating as a request service to marketing, not as a campaign partner within the revenue motion. Every campaign brief crossed a team boundary twice before anything moved.
When the ownership model was redesigned — not the tools, not the infrastructure, but who had authority to act on what — the activation window dropped to the same business day. Monthly revenue for the B2B2C product moved from ₹8 crore to ₹80 crore — not because the campaigns became more creative, but because they started reaching the right customers at the right decision moment instead of after it.
The Two-Layer Fix
The fix has two layers that work together. Getting one without the other delivers partial results.
Layer one is team design. The AI Digital Growth Pod collapses the boundary where cross-functional teams operate. Data engineers, data scientists, and growth leaders work inside the same pod — not across three separate team boundaries with handoffs between them. The pod owns the full path from insight to campaign live. No brief crosses a team line. No ticket sits in a queue waiting for a sprint slot. The team experiments together, reads the signal together, and moves together.
Layer two is activation tooling that matches that team design. A composable data activation layer sits directly on the company's existing data warehouse. A growth leader describes the target audience in plain language — "customers who purchased in the last 30 days and have not yet responded to the new offer." An AI agent translates it, executes it against live data, and delivers the audience directly into the campaign platform. Same hour. No data engineer in the middle. No separate validation cycle. No queue.
This is the combination that drove the B2B2C result above. Team design removed the handoff chain. The activation layer removed the wait time between each step. Campaign lead time went from fourteen days to one day.
The same model, applied at a regulated fintech with over 50 million customer profiles, produced these results: campaign activation from five days to two hours; experimentation velocity from two campaigns per quarter to more than twenty per month. The audience data did not change. The architecture around the decision to activate it did.
The result is not just speed. It is a different revenue motion — one where a growth leader experiments fast, reads the signal in the same week, and compounds learning instead of losing it to the queue.
Three Questions to Measure Your Own Queue Tax
Before you can remove it, you need to measure it. These three questions surface the queue tax in any organisation. You can answer all three in under ten minutes.
How many people does a campaign brief touch before the first audience segment is live?
Count the number of people — not teams, people — who have to take an action for the segment to move from "requested" to "ready." If the number is more than three, you have a queue tax. The handoffs alone add days, and each handoff carries a waiting cost that compounds across every campaign.
What is the average time from "we should run this campaign" to "the campaign is live"?
Not from approved-brief to live. From the moment someone in the room said "we should do this" to the moment a customer sees it — in calendar days. If that number is more than five, you are paying the tax. If it is more than ten, the tax is material and measurable on your CAC payback curve.
In the last quarter, how many campaigns launched more than one week after the insight that prompted them?
One week is the threshold because most high-converting signals in consumer and B2B2C markets have a seven-to-ten day window before audience intent shifts. If more than half of your campaigns crossed that threshold last quarter, you are running your entire growth engine one conversion window late, every single cycle.
These are not rhetorical questions. They are the first three questions in the diagnostic I run with every revenue team. Most CMOs and CROs can answer them within ten minutes. Almost none have been asked them before in this framing.
Map Your Queue Tax in Two Days
A two-day diagnostic that maps your exact queue — how many steps, where each handoff lives, what the calendar cost is, and what removing it unlocks in revenue velocity. Q3 slots are open.
Book the Diagnostic →The Tax Is Optional
The Jira Queue Tax is not an inherent cost of running a marketing function at scale. It is not a technology limitation. It is not the price of operating in a regulated industry.
It is a structural inheritance — a set of handoffs and boundaries that made sense for a reporting era, running inside a revenue motion that requires something different.
The revenue leaders who have removed it describe the same shift: "We stopped chasing the moment. We started moving with it." The campaigns do not feel better. The business does. The CAC payback shortens. The conversion rate lands closer to where the model said it should. The team stops feeling like they are always one step behind.
If campaign velocity is on your agenda for this half, reach out: amit@transformtechx.com.
How many steps does your team take from insight to campaign live? Drop the number in the comments on LinkedIn. I will respond to every one with where your queue tax is likely sitting.